WebGIS-based Landscape Architecture Analysis System
1. Problem Statement and Product Positioning
In landscape and architecture planning and design, site analysis always encounters three types of challenges: First, data is scattered and difficult to integrate. Ecological (climate, hydrology), morphological (architecture, transportation), and humanistic (population, POI) data are scattered across different documents or tools, so that finding hydrological data for a single site may require searching through multiple materials. Second, software operation is complex. It required frequent switching between tools such as GIS and Excel when analyzing terrain and conducting population statistics, which has a high threshold for designers without a technical background. Third, analysis efficiency is low due to repeated location and transportation analysis, and manually drawing buffers can take half a day.
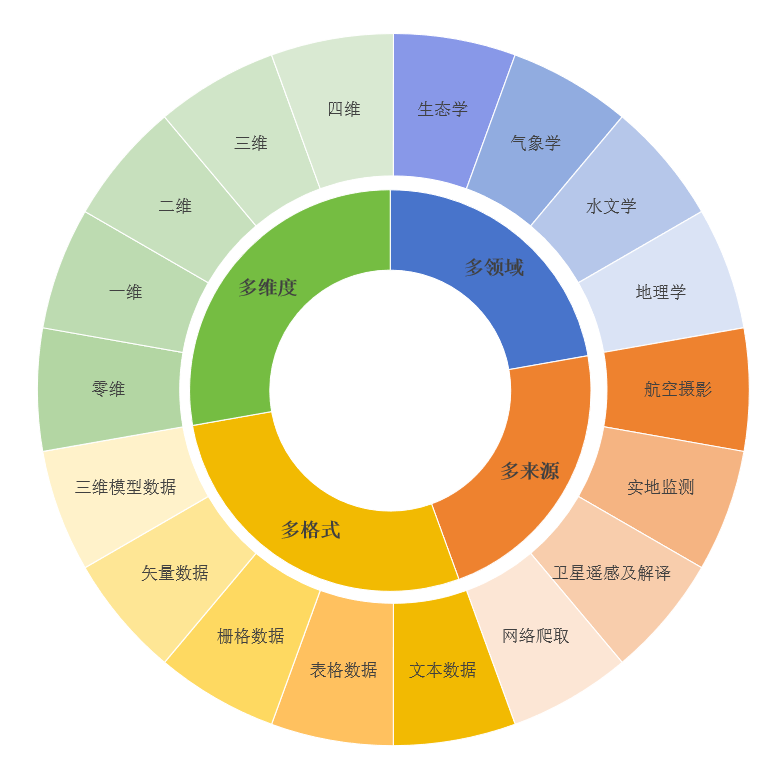 Figure 1 Multi-source Heterogeneous Data Types
To solve these critical issues, we have developed a prototype of a landscape architecture analysis system based on WebGIS technology. Rather than replacing designers’ creativity, it is positioned as a ‘site analysis auxiliary tool’—It integrates 10 types of data across three categories: ecological, morphological and humanistic, offering support map browsing, data query, spatial analysis (such as buffers, heat maps), and thematic map visualization. It caters to three groups: practicing designers (facilitating quick organization of site data), design firms (simplifying multi-project analysis workflows), and research/academic teams (visualizing site characteristics). It provides fundamental support for the industry’s transformation from ‘manual integration’ to ‘digital analysis’.
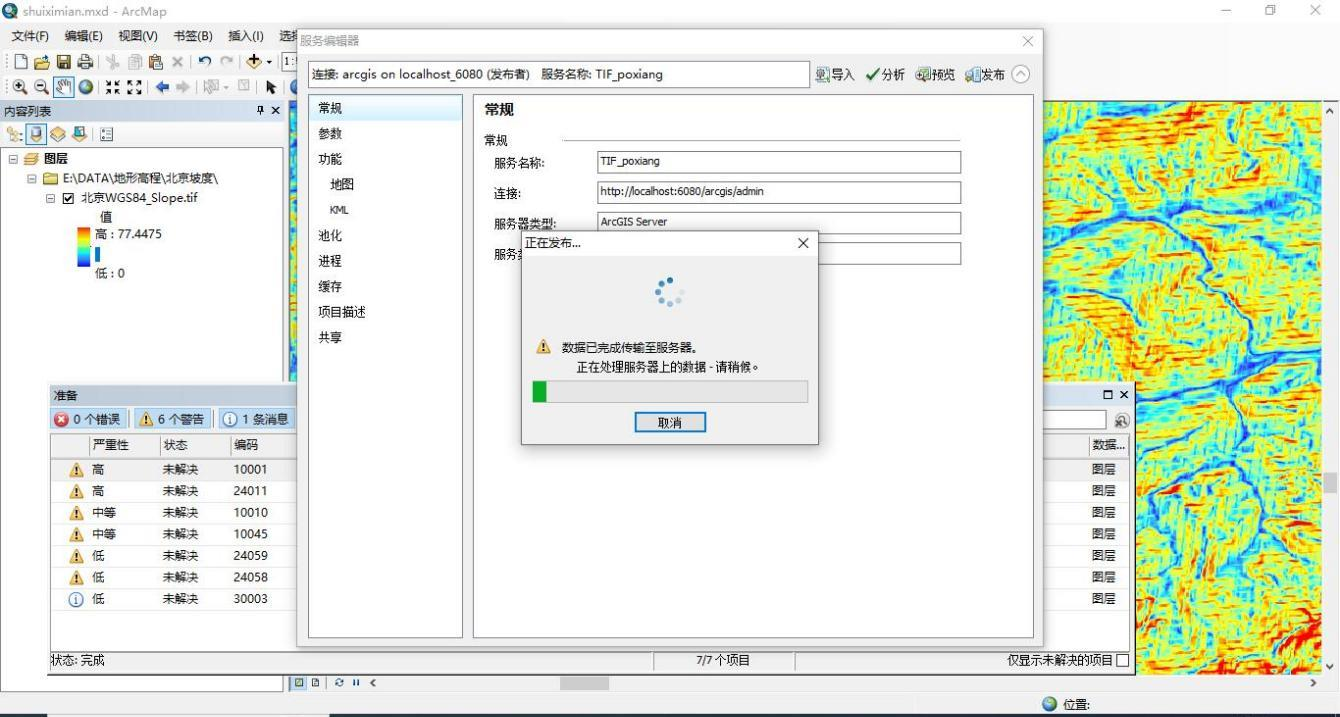 Figure 2 Publishing Terrain Slope Data Service in ArcMap
2. Practical Value and Performance
Based on the tests, the system is now able to meet the core requirements. For designers, obtaining site information no longer requires switching between platforms. For example, to check vegetation coverage in a specific area, users simply select the city and month in the system to view a thematic map of vegetation distribution, saving 70% of the time compared to manually searching for remote sensing data. Using buffers to analyze the 3-kilometer service area around a park, results can be generated in minutes, eliminating the need for manual drawing. For design firms, when handling multiple projects simultaneously, the system manages data uniformly, such as population and transportation data from different cities, which removes the burden of separate data collection for each project. It can also generate standardized analysis reports, reducing repetitive work. For science teams, displaying thematic maps, such as terrain elevation and land cover, enables intuitive presentation of site characteristics. For instance, when teaching, using heat maps to illustrate the distribution patterns of POIs makes it easier for students to understand. Currently, the system can stably handle the basic analysis, data query, and visualization for small and medium-sized sites (such as community parks and campus green spaces), and the results meet the actual requirements.
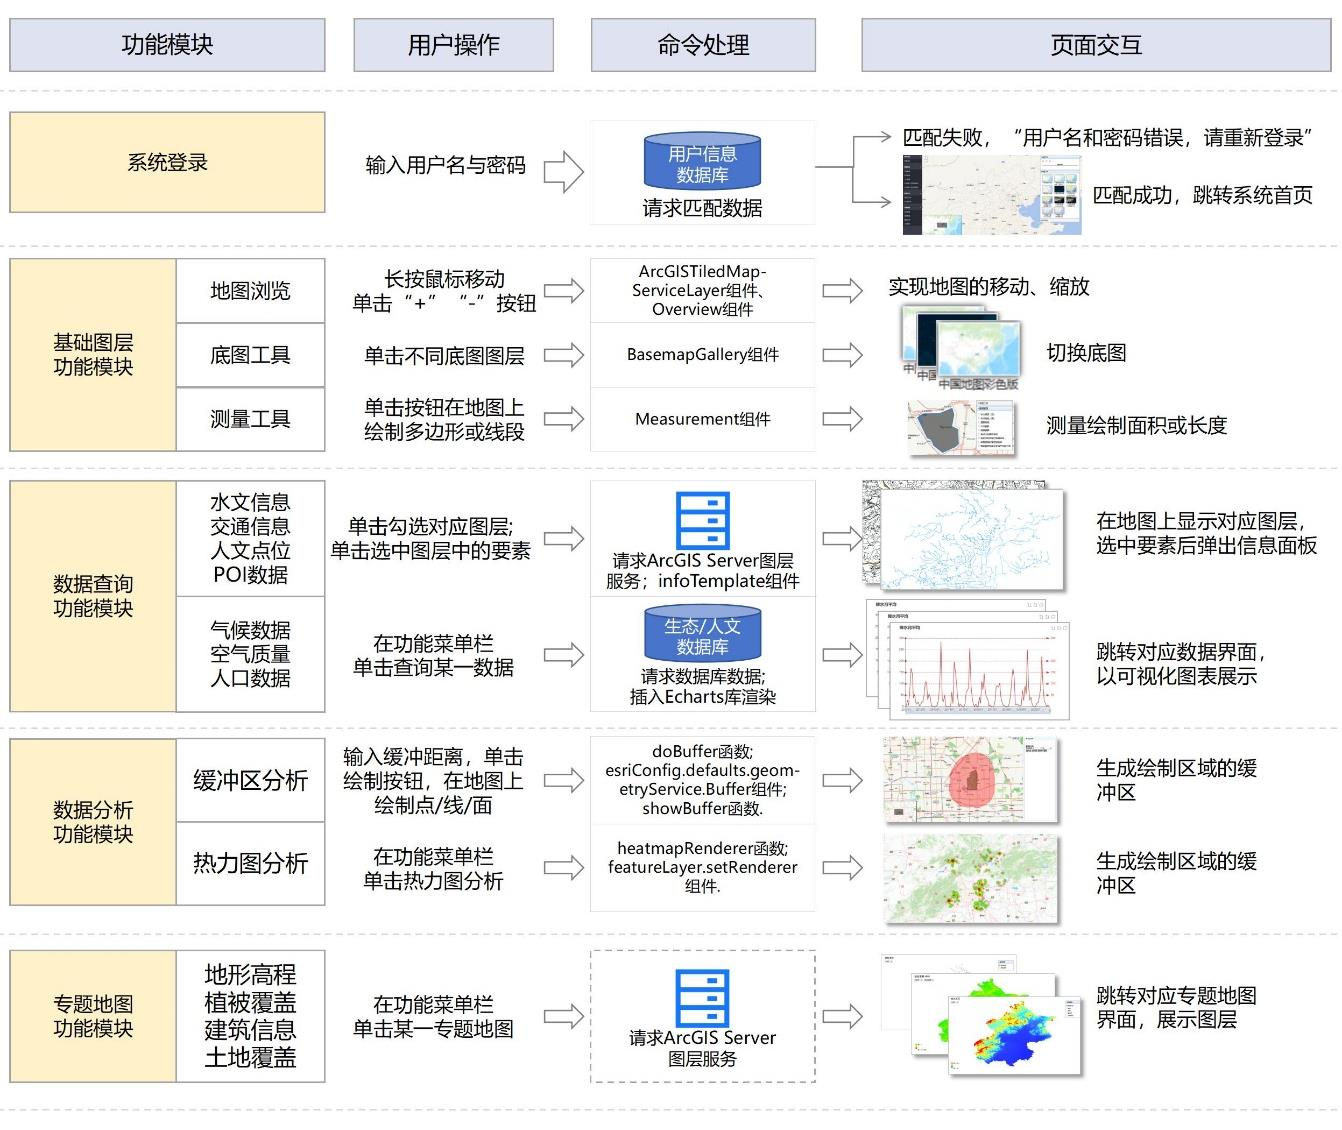 Figure 3 Functional Module Design and Implementation Results of the Landscape Architecture Analysis System
Currently, the system still has room for improvement in terms of 3D data integration (such as 3D architectural models), complex environmental simulation (such as wind environment, sunlight analysis) and user interface optimization. If you are a landscape design company aiming to enhance the efficiency of site analysis; or a team developing garden software needing to integrate WebGIS analysis functions into existing tools; or a research institution seeking to customize specialized analysis modules (such as ecological restoration scenarios), please feel free to contact us. We can provide technical details, such as customizing specific regional data sets, developing exclusive analysis functions, or providing interface adaptation for existing workflows, making the system more applicable to actual applications and facilitating the implementation of academic achievements in industry practice.